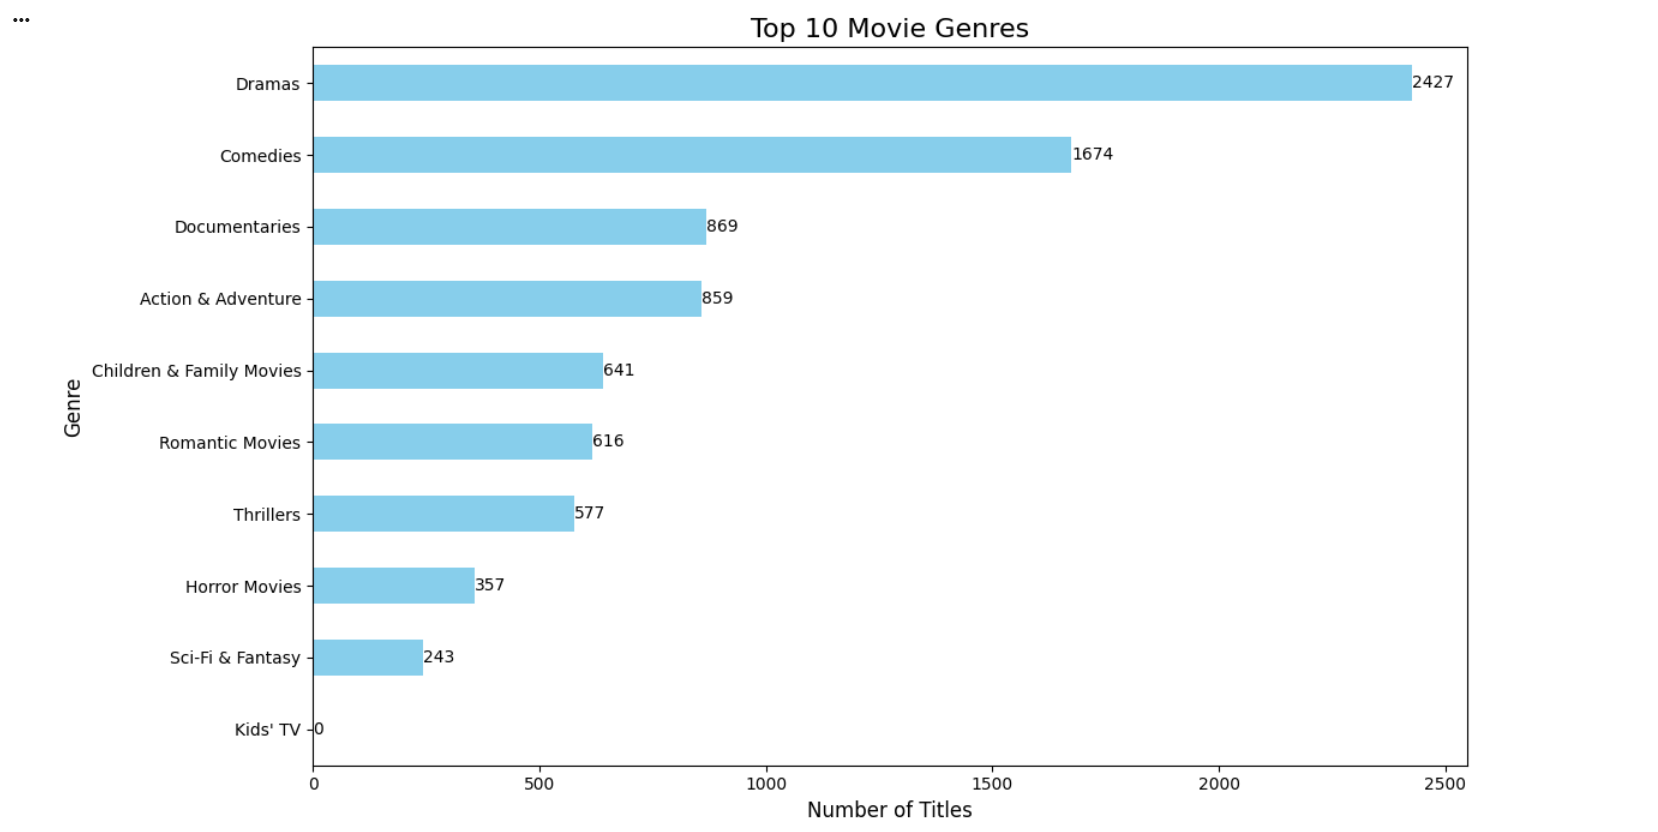
Movie Title VS Genre
This horizontal bar chart shows 10 different categories representing ten popular genres of movies based on the number of titles in each genre.
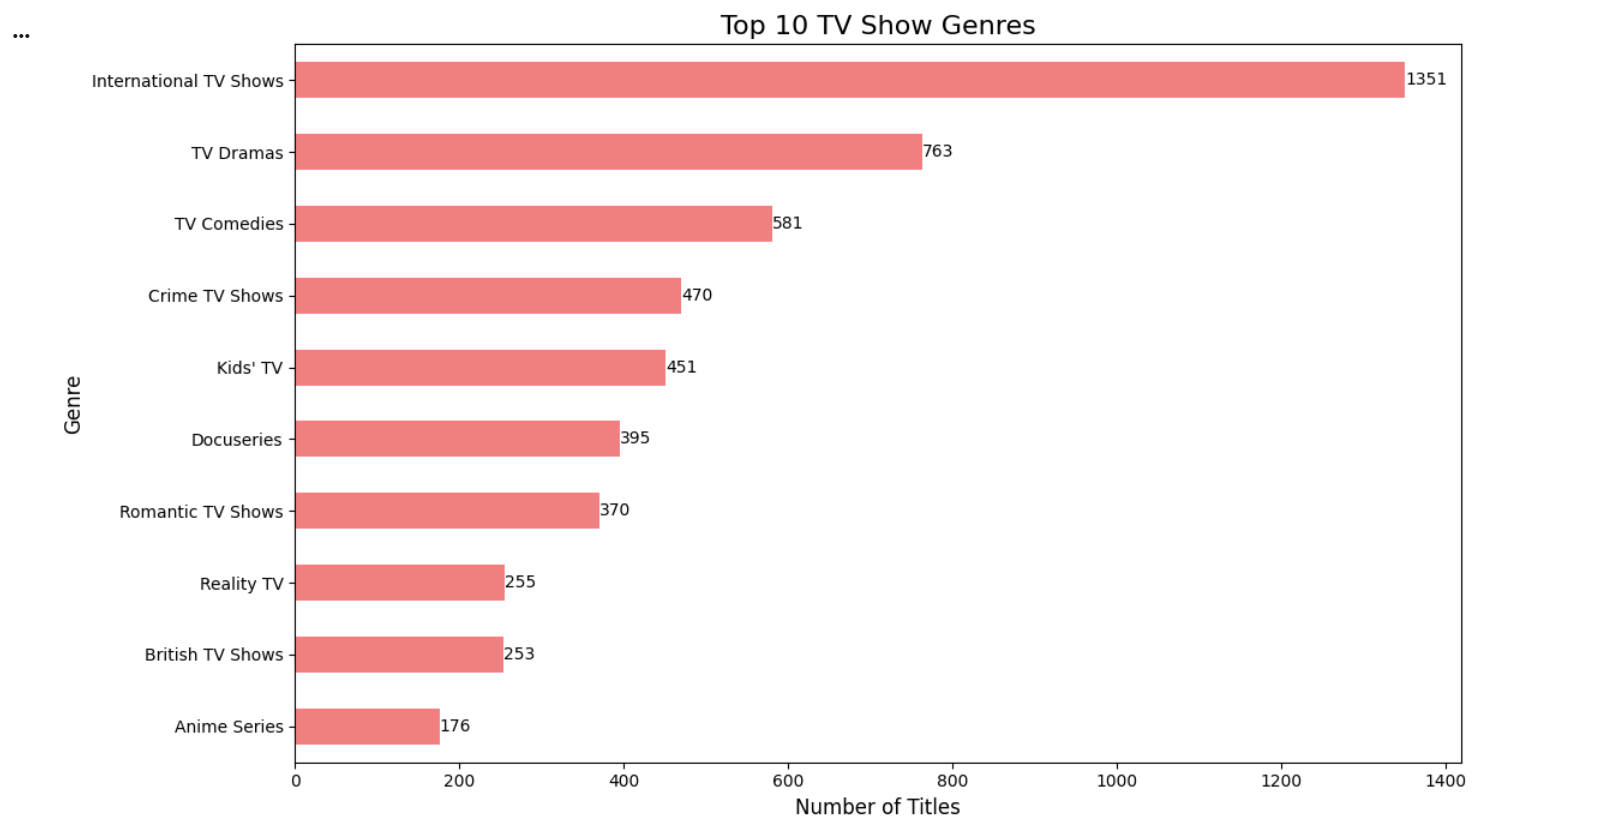
TV-Show Title VS Genre
This horizontal bar chart shows 10 different categories representing ten popular genres of tv-shows based on the number of titles in each genre.
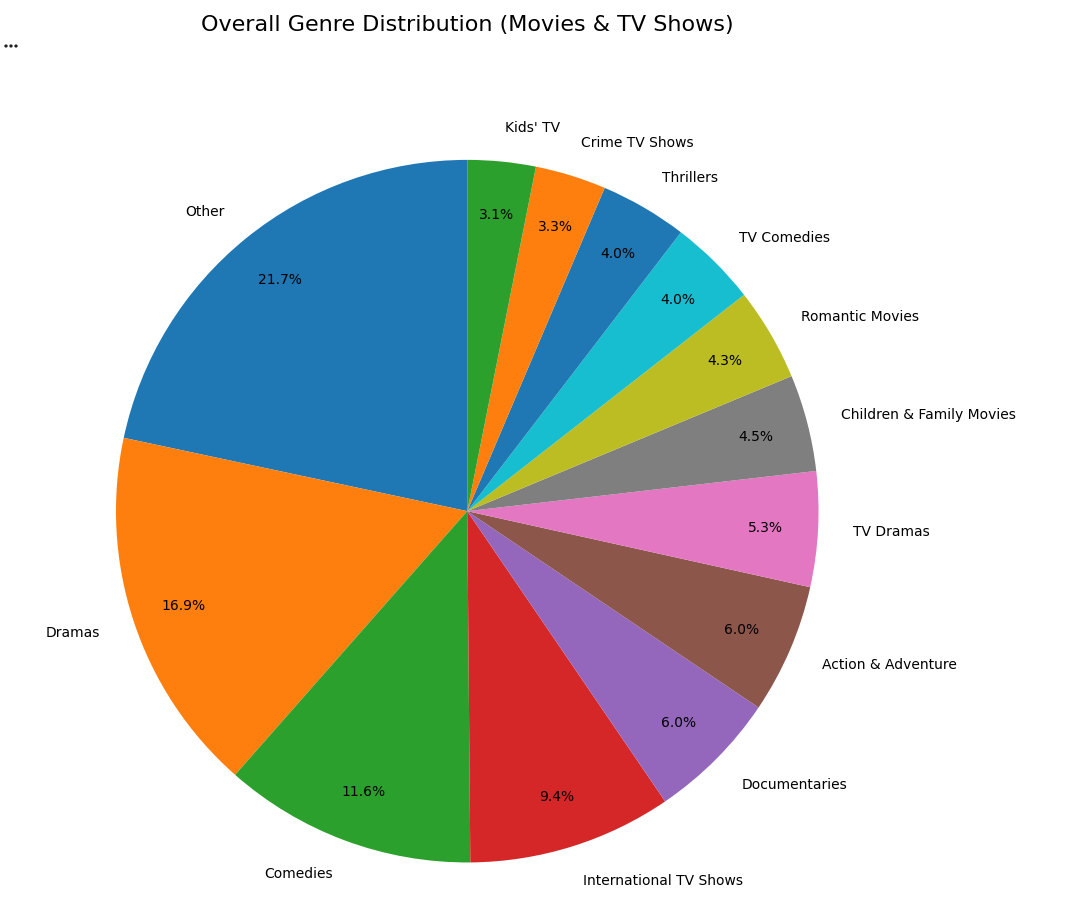
Overall Genre Distrubution (Movies and TV-Shows)
This pie chart shows 13 different categories representing the most popular genres of the Netflix content based pn the number of title in each genre